
The parallel funny walk stepping into what some folks might consider an “esoteric” accumulation of concepts around pictorial depictions is now interrupted by a brief return to our standard programming; the nuts and bolts of this ridiculous romp along physical grounds.
As we iterate back over our history, we can flesh out more specifically what some of this ridiculous math nerd number fornicating landscape means. We revisit Question #5 where we posed the question as to what the numerical value corresponds to.
At that point, it was deemed too soon to draw attention to the nuance of what these numbers are, and instead went with a blunt force trauma description with the hope that attention would be drawn to the idea that the meaning of numbers does not exist solely within the number itself, but in reference to a broader set of implicit constructs.
It is a good opportunity though to take a slightly more critical look at the numbers, and what they mean, to drill to a deeper level. In this post, we will try to take the slippery idea of the numbers, attach them to a physically meaningful unit, and then attach the physically meaningful unit to the entry point of our phenomenological system.
Phew… what a mouthful of nonsense.
Question #34: What does the unit 0.5 mean with respect to a display medium?
Back at Question #5 we tried to get a superficial understanding that the numerical unit of metric alone is not meaningful. A discrete scalar quantity of something is only meaningful in a broader set of implicit or explicit relationships.
At Question #13, we introduced the colourimetric Standard Observer model. A key facet of this model is worth focusing on. Let’s borrow Ed Georgianni’s1 passage:
The chromaticity diagram is a stimulus specification. A given color perception can be elicited by a stimulus represented by just about any point on the chromaticity diagram, depending on the nature of the visual field and the viewer’s state of adaptation.
Digital Color Management: Encoding Solutions, but something that every PBR render wonk can arrive at logically if they apply their grey matter
Anyone who knows a bit about the author of the site you are reading this upon, knows that said author has frequently pushed back against Giorgianni’s framework of “Scene” and “Display”, which has been on the cusp of being eviscerated in the prior Question #34 and Question #35. That said, the above quotation from Giorgianni is well worth appreciating in full, for all of its incredible wisdom. Specifically, the idea that all of colourimetry is a stimuli specification. One should be wondering why “colour” was placed in the term at all!
As we have seen by way of Question #26, where we started to loosen the false binding of “stimuli” to “colour” by using “stimulus colour”, we can revisit this separation of Church and State a bit more…
When folks speak about colour, they are referring to an incredibly elusive thing in our meatware. But what “stimulates” colour, and is it “stimulated” in a causal sense at all?
Anyone who has been poked in the eye knows that colour can be “stimulated” by the electromagnetic “force” energy transfer of a finger. Sometimes, if one is close to passing out, visual colour experience can be formed in the cognitive pathways in the form of “Tweetie Bird Stars”; those peculiar shots of light that one gets near the periphery of vision sometimes.

The bottom line is that there’s a good number of different ways to induce a visual cognition, but the energy that we are talking about here is a very specific form of stimuli; electromagnetic radiation in the normative observer’s visually sensitive range.
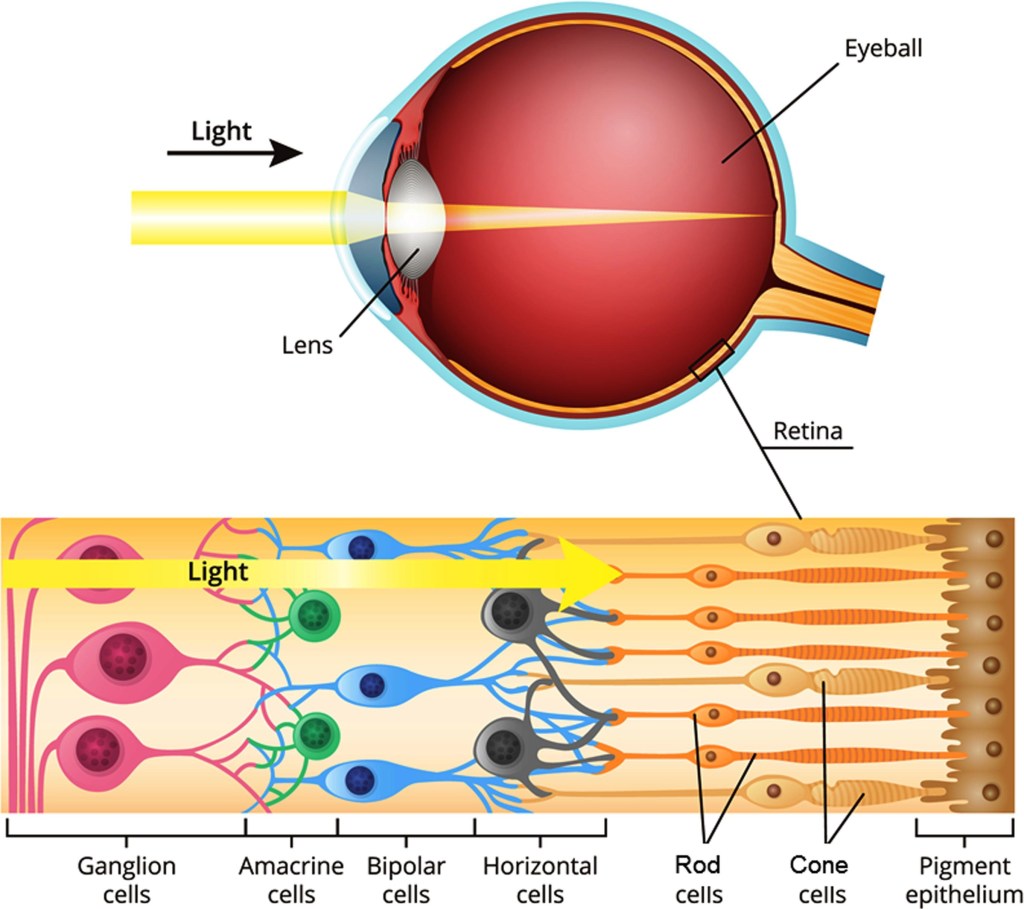
When we look at a breakdown of the retina, the part of our biology we are initially interested in are the rods and cones. The following diagram, borrowed from Moos et al.2, shows us the relative position of the rods and cones.
At this point I’d like to give a derogatory shoutout to the WANKers out there from Question #1‘s footnote number two with the following paragraph dedicated explicitly to them.
In nearly every Flying Spaghetti Monster discussion around colour, you’ll get the following woefully misleading Flying Spaghetti Monster forsaken plot, a general hand wavy clap clap, and then blah blah “ET VOILA – COLOUR!”. Every time you read a post featuring this sort of a vibe, feel free to ignore everything; there is a greater than 100% chance you are being mislead. I won’t link to a few of these garbage posts or marketing posters as they are too numerous to count3. And that “knowledge”? It gets parroted and repeated and parroted and repeated and parroted repeated until it is legitimated by way of repetitive “authority”.
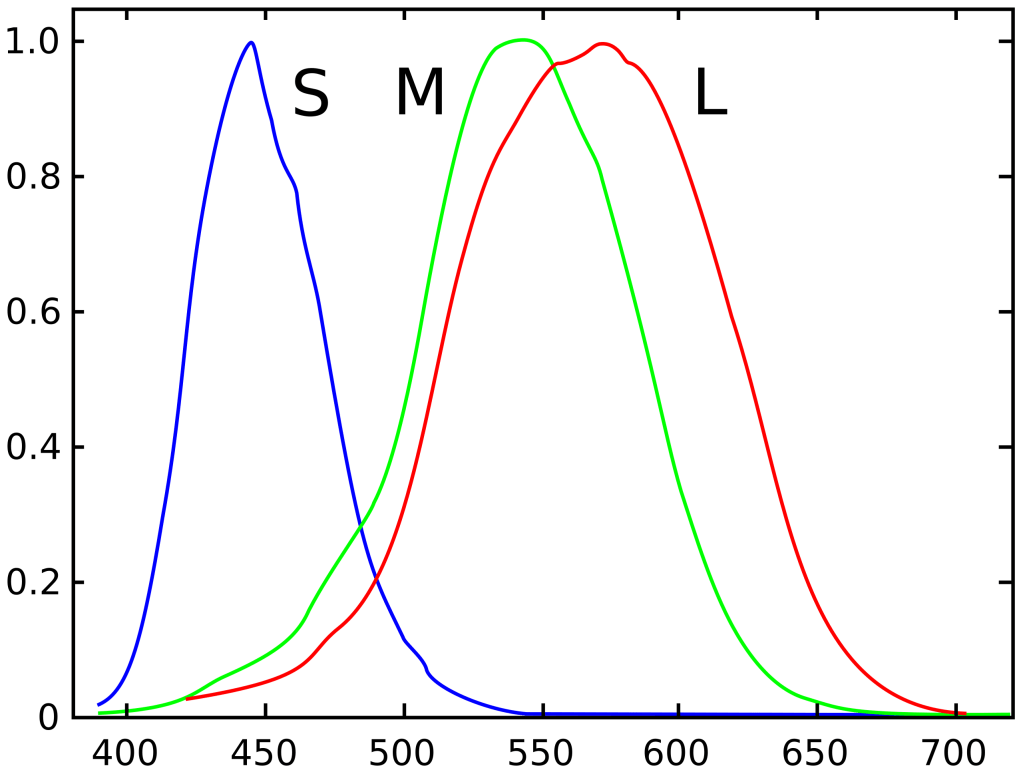
Hopefully most readers here have a bit of an inclination as to why this ridiculously impoverished and reductionist framing of colour cognition is complete bullsh*t. Do the cones broadly respond to a specific range of electromagnetic radiation? Yes. Is there some sort of “neural quantification” of this signal directly from the rods and cones? No. Is “colour” “contained” in the sensitivities that this plot describes? F*ck no.
The purveyors of these nonsense diagrams will attempt to claim the authoritative high ground, frequently without a shred of biologically plausible references to back up their claims. They will just vomit forth elaborate diagrams, with further bogus mathematical formulations, that peddle a very specific, and problematic, physicalist ideology.
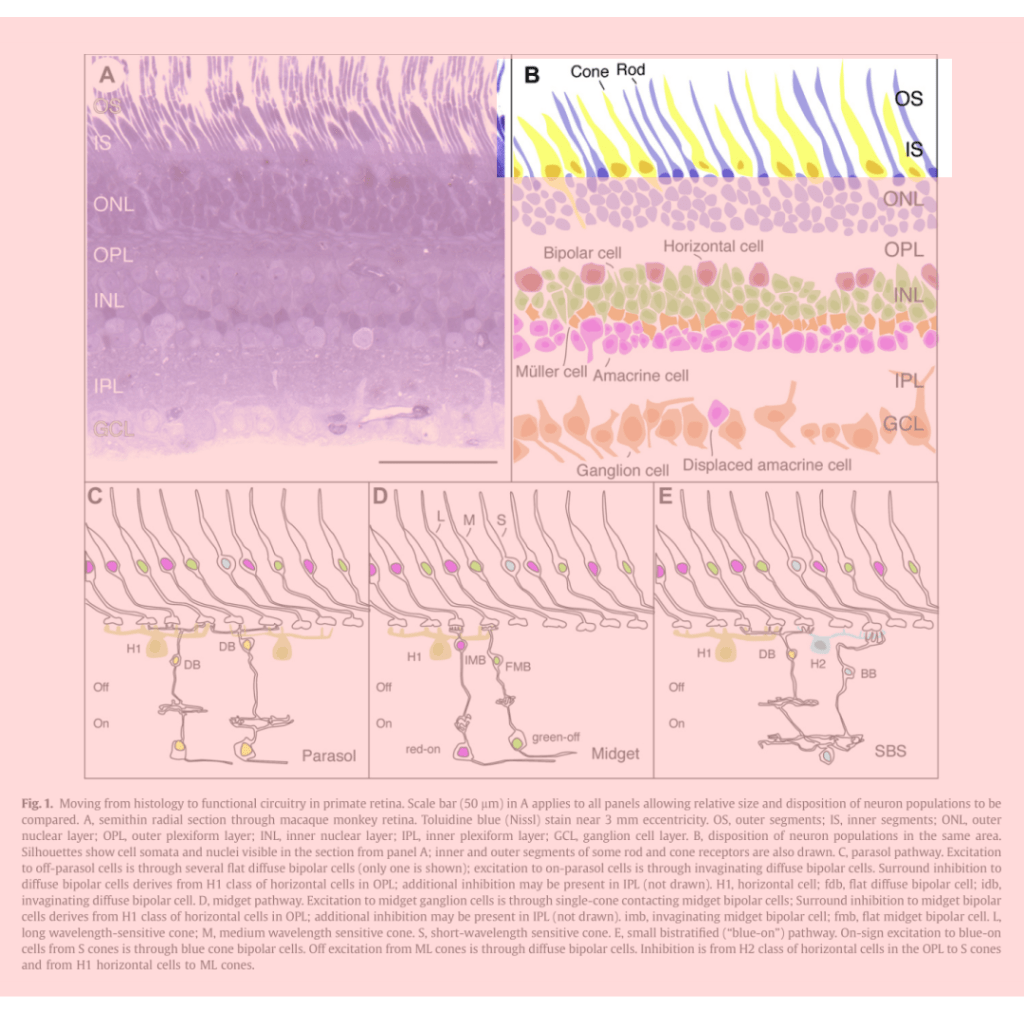
If we are to discuss stimuli’s relationship to energy, and forward a colourimetric world view ideology, we are effectively falsely reducing the above retinal depiction from Danilova and Mallon4 to the small cropped region. Imagine trying to convince people to ignore what amounts to the totality of the visual cognition system and focus strictly on an absorptive profile of the cones as “colour”!
Further, it should be noted in all caps that the retinal neurophysiological signal should never be considered to consist of a “measured”, as a scalar discretized magnitude, signal!
The retina is not at all like a camera!
Your idiot author
In short, when anyone sees these diagrams presented without incredibly strong caveats to resist false inferences, they should promptly present the individuals or groups with the LMS Angry Goose…

With this incredibly strong caveat to avoid conflating colour with neurophysiological signal stimuli out of the way, let’s look more deeply at the concept of stimuli backwards one step, moving backwards in time from the all-too-prevalent LMS plot…
If we go back… way back… to 1924, we have the origin story of the colourimetric stimuli specification beginning to take shape. For some folks, 1924 is a date that is unfamiliar when compared to the more familiar 1931. So what is the link?
1924 signifies a leap forward in terms of colourimetric stimuli specifications because this5 is the origin date of the standard that became “the” luminous efficacy function. This function is what becomes the baseline of all colourimetry to follow for over a hundred years. That’s this plot, borrowed from Wikipedia.
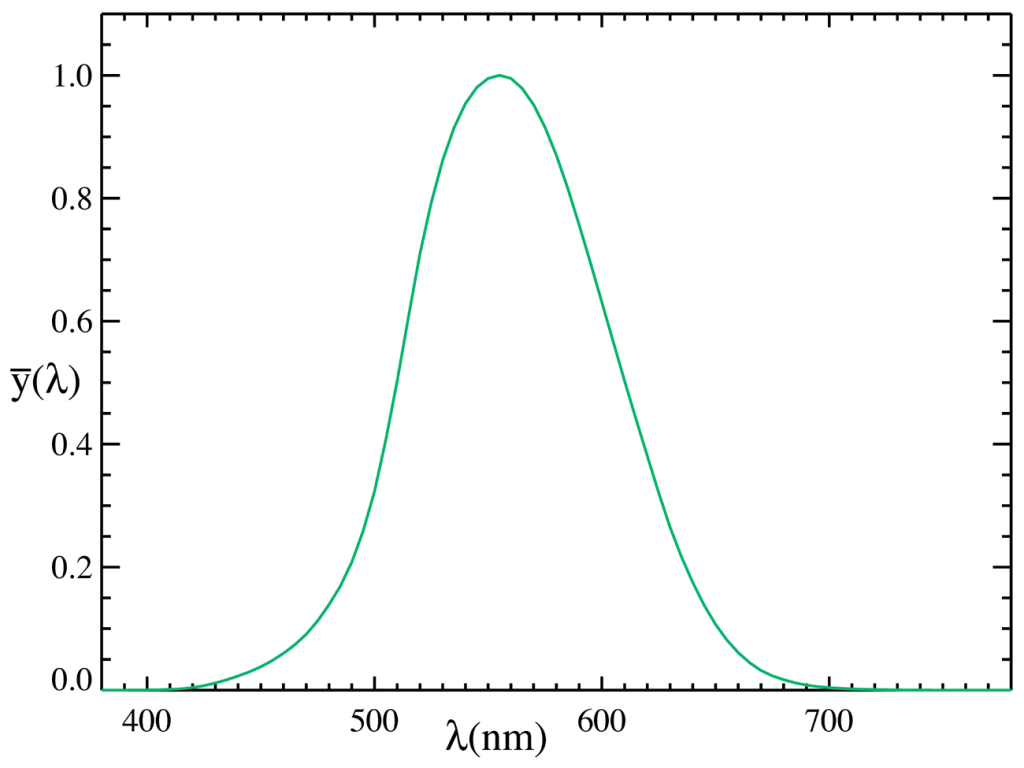
This function is an attempt at a quantification of the radiometric energy as effective “strength” in terms of a neurophysiological signal. Note it is important to not conflate this “strength” with “brightness” or “lightness” or “darkness”, as these are vastly more complex cognitive computations!
What we can say about this luminous “flux” is that it is a more or less direct line to our neurophysiological signal transduction, and that’s about as rigidly we ought to be defining it at this juncture. If we pump in W watts of energy at 555 nanometers, we have Y response in terms of sensitivity.
This 1924 research anchor is perhaps more of a boat anchor. That is, the way it was arrived at wasn’t even an average of the limited nature of the experiments at the time. I’ll let some of our most canonized experts on this subject explain. Here is a passage from Sharpe, Stockman, Jagla, and Jägle6:
In 1924, the CIE (1926) adopted a standard photopic luminous efficiency function for 2º angular subtense photopic viewing conditions, CIE 1924 V(λ), which is still used today to define luminance. Unfortunately, V(λ) is a speculative hybrid function, originally proposed by Gibson & Tyndall (1923), artificially smoothed and symmetrized from very divergent data measured under very different procedures at several laboratories (see Figure 1, continuous line). In fact, the final result was not even an average of the experimental data, but a weighted assembly of different sets of data (Wyszecki & Stiles, 1982); some of which were not the optimal choice.
That’s right… 1924’s luminous efficacy function was rather pooched, but onward we must forge…
With a rigid function, albeit of questionable veracity, in place, we have a binding metric scale between stimuli wattage and one of the “dimensions” of neurophysiological response. Fast forward to 1931, when the CIE ratifies the CIE XYZ model based on top of the CIE 1924 luminous efficacy function7.
Wright89 and Guild10 are often uttered in the same breath as though they were a team during their research. Their work was actually independent of each other initially, then the congruencies were revealed after their independent efforts, and amalgamated into the canonical Wright and Guild singularity. This is what forms the basis of the 1931 CIE XYZ model.
What we want to focus on here though, is the nature of their experiments. That is, let’s try to extract out the specifics from Wright’s work in order to elucidate just what the underlying metric the entire model rests atop of. Here’s Wright himself, writing in 192911.
A simple example of the method may be useful. Suppose that the intensities of the primaries in the colorimeter are controlled by variation of sector openings and that these angular apertures for the white match are 30″ for red, 15″ for green, and 60″ for blue. To correct these readings so that they are in equal proportions, a factor of 2 must be applied to the red and 4 to the green and these factors must be used in any subsequent colour match.
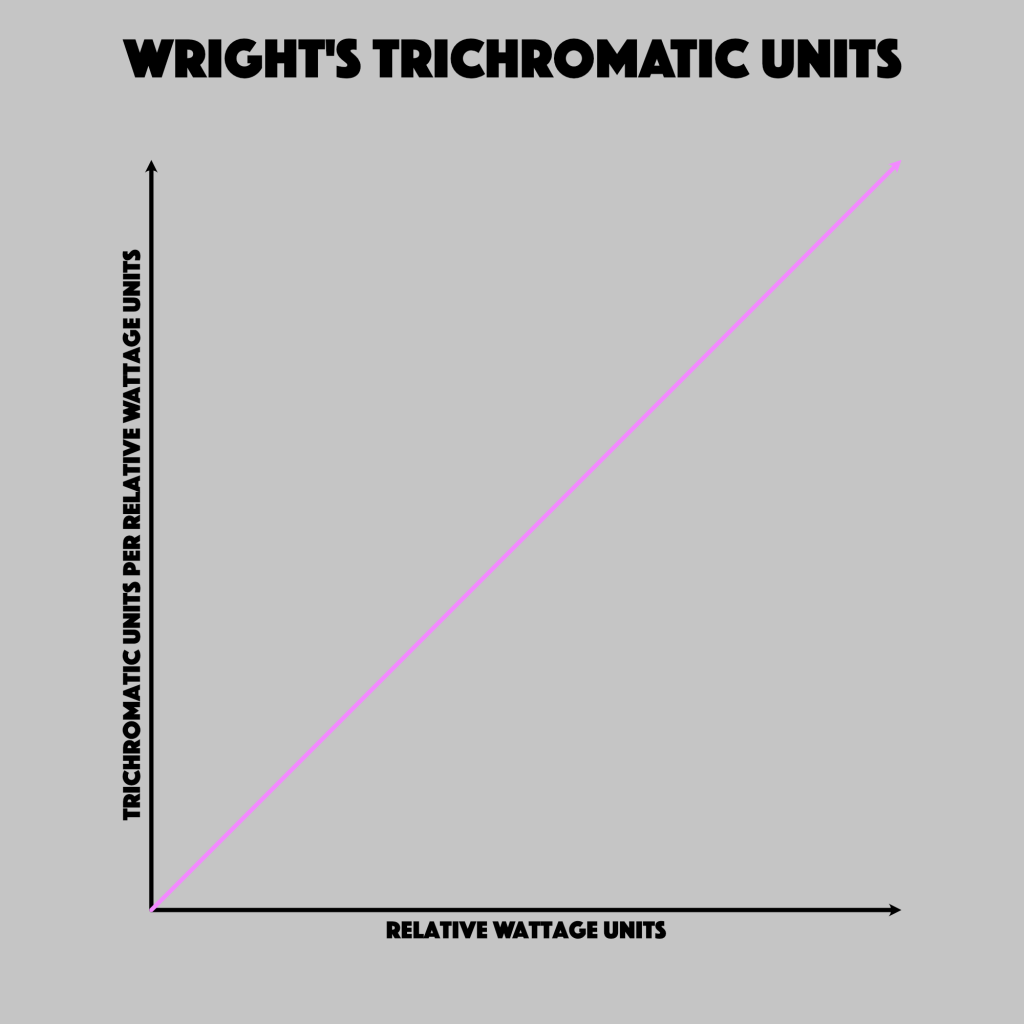
Let’s draw our attention to how Wright is conducting his work, specifically by the way he uses the term “openings” and “angular apertures”. This is basically a simple energy constriction device, and Wright is attenuating the quantity of energy by way of these apertures. Why is this significant? Because given we are speaking of energy, we can state clearly that at this juncture their controls can be expressed effectively using radiometric wattages, gated by the unit area of the opening.
A square field of view, divided horizontally into two equal rectangles, has been used, the whole subtending approximately 2° at the eye. This ensures that the fovea alone is involved in the colour matching and so avoids complications which might arise from the varying structure of the retina; it further ensures that, in general, the image falls entirely within the bounds of the yellow spot. A 2° field is in line with the standard suggested by Guild and with the standard used in flicker photo- metry. The effect of a light surround field, as used in flicker photometry, was also investigated, a surround field of about 10° angular subtense being provided.
Wright is using these relative stimuli energies in relation to evaluating a minimally distinct border between two samples abutting one another.
Fast forward to the 1931 work, and the final CIE XYZ derivation. The idea of the resultant CIE 1931 XYZ model is aligned with the earlier 1924 luminous efficacy function, where the Y component is quite literally a relative projection of the luminous efficacy function per “angular” wavelength. In the end, we have a model that is a relative wattage unit of energy, discretized into a three dimensional luminance gained set of units. The basic “ruler unit step” metric is relative to that luminance unit step outlined above from 1924.
From that, we end up with another ridiculously overly reproduced plot borrowed from the Wikipedia entry. I am loathe to present it here, but we must, as long as folks remember the strong caveat to consciously avoid the conflation of colour-as-cognitive-inference with the relative stimuli signal. This is doubly the case, because this is actually a plot of the CIE stimuli selection as a fabricated model, with no real “direct” relation to the neurophysiological signal. It is a derived and artificial projection:
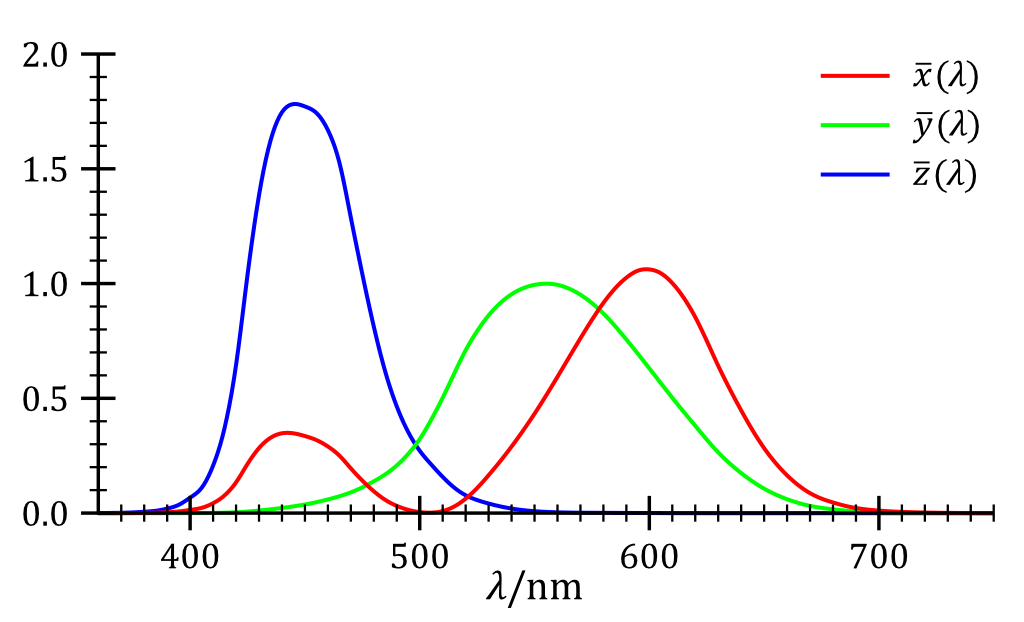
What we end up revealing in this plot is that the input relative wattage is distributed across three CIE XYZ artificial model signals. The design of the original CIE XYZ projection was decided to be all positive, and as such, we cannot overlook that humans have meddled in the construction here.
One of those signals is the hopefully now familiar relative luminance, or Y in the above plot. The other two are even more abstract, being X and Z. Despite being abstracted constructs, these two are incredibly important as they are related to the neurophysiological chrominance signal “enmeshed” in the CIE 1931 XYZ model. Let’s lean on a definition from Boynton in 196012:
We are now in a position to define a new term: chrominance. Whereas luminance refers to a weighted measure of stimulus energy, which takes into account the spectral sensitivity of the eye to brightness, chrominance refers to a weighted measure of stimulus energy, which takes into account the spectral sensitivity of the eye to color.
Theory of Color Vision, Boynton R. M.
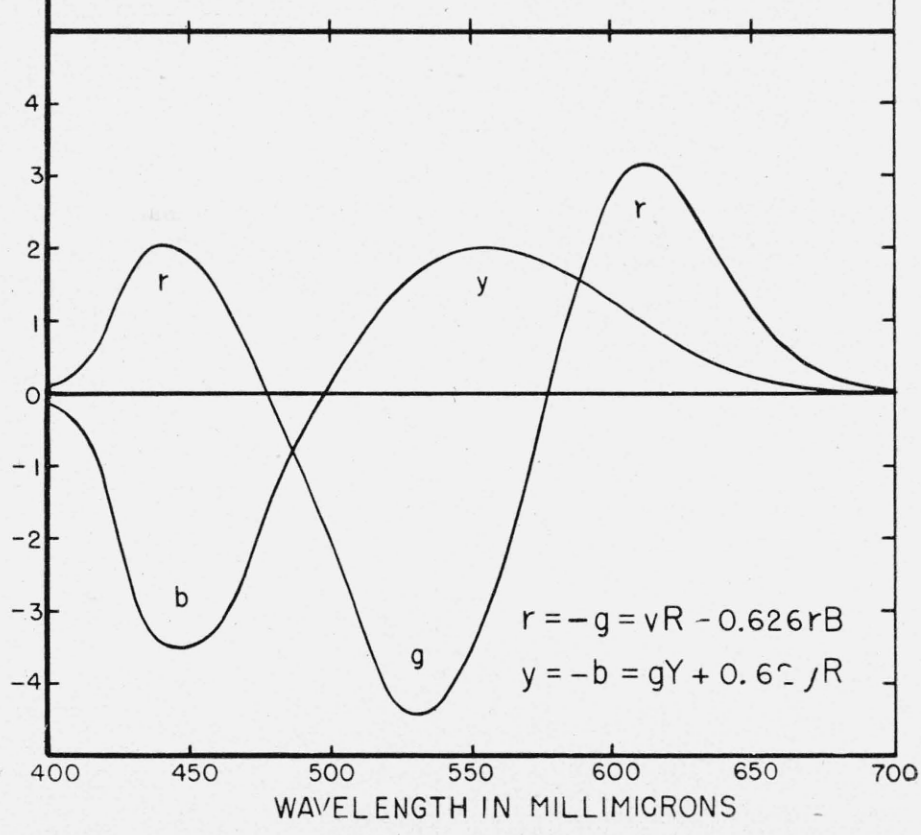
Why do I say that the chrominance signal is enmeshed in the above CIE 1931 XYZ plot? Because Boynton, Judd, and Müller before them, all focus on the signal at the theorized neurophysiological inhibited result, as opposed to the direct first order absorptive profile of the cones. That is, the following is suggested to be a representation of the “optic signal” manifestation of the incoming electrostatic signal. Boynton uses the following plot to showcase this inhibitory signal:
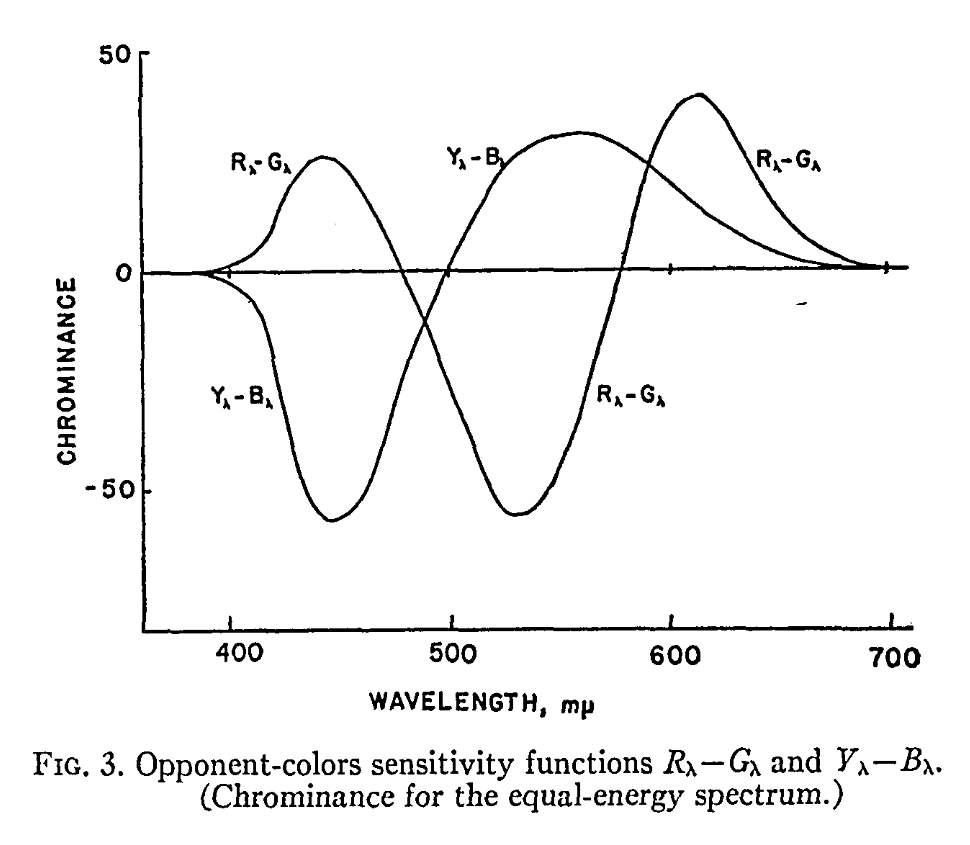
Here’s Judd’s work from 194913:
This similar diagram is included as a point of departure from the parroting of the earlier plots. It is this plot that folks really ought to be considering with far more attention than those all-too-familiar CIE XYZ and LMS plots, because it is the above signal formulation that provides us with potentially far deeper insights. Those interesting insights from subsequent research will have to wait a bit, though!
We should remember that we have a number of ideas wrapped into the CIE XYZ model, but first and foremost, we ought to remember that it’s just that — a human crafted model.
The electromagnetic radiation stimuli can be measured as a wattage, and that wattage can be thought of as being decomposed into different signal components that form the basis of our expressed dimensions. The components in the CIE XYZ model, however, are more or less a fictional projection that have some relationship to what the theorized lower order increment and decrement signals might be, as theorized by Müller and later estimated by Judd. To that end, let’s permit Wright himself to describe the nature of the base units of the CIE XYZ model.
This restriction, in effect, separates the two variables, luminosity and colour, so that each can be dealt with individually. When the coefficients add up to unity the colour equation is referred to as a unit trichromatic equation and the amount of colour represented by the equation is one trichromatic unit (one T. unit).
A Re-Determination of the Trichromatic Coefficients of the Spectral Colours, W. D. Wright.
Alright… let’s wrap this already too long bit of website diarrhea…
With some effort we have hopefully managed to peel back a bit more of the subtle nuance behind the numbers of our “colour spaces”. The CIE Standard Observer XYZ model is a stimuli specification, and said stimuli is a relative expression of radiometric energy to some sort of neurophysiological signal response. A common unit of energy for heat, light, or motion is wattage. Wattage serves us well here, because it is one of the most common ways to quantify electrical or electrostatic energy, which happens to be the energy unit fed to our display mediums, and at least plausibly a useful unit for the theorized electrostatic propagation of our upstairs meat sausage.
We have traced the origin of the wattage-to-neurophysiological response to the origin story of the CIE 1924 luminous efficacy function, and how this base unit is used to express relative units of the subsequent CIE 1931 XYZ model. That is, in short…
Answer #34: The RGB encoded value of 0.5 in our original question is decoded to a relative wattage in the software and hardware of our display mediums and systems. This relative wattage can be expressed under a baseline metric of relative trichromatic units, which are equally partitioned relative to luminance units.
Why is it important to think about wattage? Sure, relative wattage is a heck of a useful way to realize that RGB values “work” in PBR rendering because they are just that — units of wattage! But what relation does external energy have in relation to our complex colour cognition machinations? How does this elucidation of wattage, and the Boynton / Judd / Müller twin chrominance signals relate to broader mysteries of colour cognition?
SPOILER ALERT: I restate that while some incredible minds are vastly further ahead than most of us, no one has a shred of a clue how visual cognition works in the totality, and that includes this idiot author. With that said, it is with tremendous hope that we might be able to trace the outline of a fascinating murder mystery by tracing this historical archaeology further, with the aid of some intriguing research papers and astute minds.
Let’s hope that this leads to a less rickety understanding of colour cognition. Onward to the next post…
- Giorgianni EJ, Madden TE. Digital Color Management: Encoding Solutions. 2nd ed. J. Wiley; 2008. ↩︎
- Moos WH, Faller DV, Glavas IP, et al. Treatment and prevention of pathological mitochondrial dysfunction in retinal degeneration and in photoreceptor injury. Biochemical Pharmacology. 2022;203:115168. doi:10.1016/j.bcp.2022.115168 ↩︎
- If you happen to be the author of one of them reading this, shame on you. You know who you are. If one feels “seen” by this footnote, there’s a good chance that you are indeed part of the problem. As a means toward redemption, add caveats to your blog posts, your diagrams and posters, or your general presentation. Show some humility and introspection. I know you are better than that! The human visual cognition system is awe inspiringly complex and fascinating, and that is likely why you started down this path in the first place! Don’t snuff out this awesome and magical thing for newer folks who are unfamiliar with the concepts. Instead, inspire them to grow their curiosity on how perplexing and incredible this evolutionary biological experience is! ↩︎
- Danilova MV, Mollon JD. Superior discrimination for hue than for saturation and an explanation in terms of correlated neural noise. Proc R Soc B. 2016;283(1831):20160164. doi:10.1098/rspb.2016.0164 ↩︎
- International Commission on Illumination 1924 :, National Physical Laboratory (Great Britain). Commission Internationale de l’Éclairage, Sixième Session, Genève, Juillet, 1924 : Recueil Des Travaux et Compte Rendu Des Séances. University Press; 1926. ↩︎
- Sharpe LT, Stockman A, Jagla W, Jägle H. A luminous efficiency function, VD65* (λ), for daylight adaptation: A correction. Color Res Appl. 2011;36(1):42-46. doi:10.1002/col.20602 ↩︎
- International Commission on Illumination 1931 : Commission internationale de l’éclairage … huitième session, Cambridge–Septembre 1931. University Press; 1932. ↩︎
- Wright WD. A re-determination of the mixture curves of the spectrum. Trans Opt Soc. 1930;31(4):201-218. doi:10.1088/1475-4878/31/4/303
↩︎ - Wright WD. A re-determination of the trichromatic coefficients of the spectral colours. Trans Opt Soc. 1929;30(4):141-164. doi:10.1088/1475-4878/30/4/301 ↩︎
- Guild J. The colorimetric properties of the spectrum. Phil Trans R Soc Lond A. 1931;230(681-693):149-187. doi:10.1098/rsta.1932.0005 ↩︎
- Wright WD. A re-determination of the trichromatic coefficients of the spectral colours. Trans Opt Soc. 1929;30(4):141-164. doi:10.1088/1475-4878/30/4/301 ↩︎
- Boynton RM. Theory of Color Vision. J Opt Soc Am. 1960;50(10):929. doi:10.1364/JOSA.50.000929 ↩︎
- Judd DB. Response functions for types of vision according to the Müller theory. J RES NATL BUR STAN. 1949;42(1):1. doi:10.6028/jres.042.001 ↩︎
